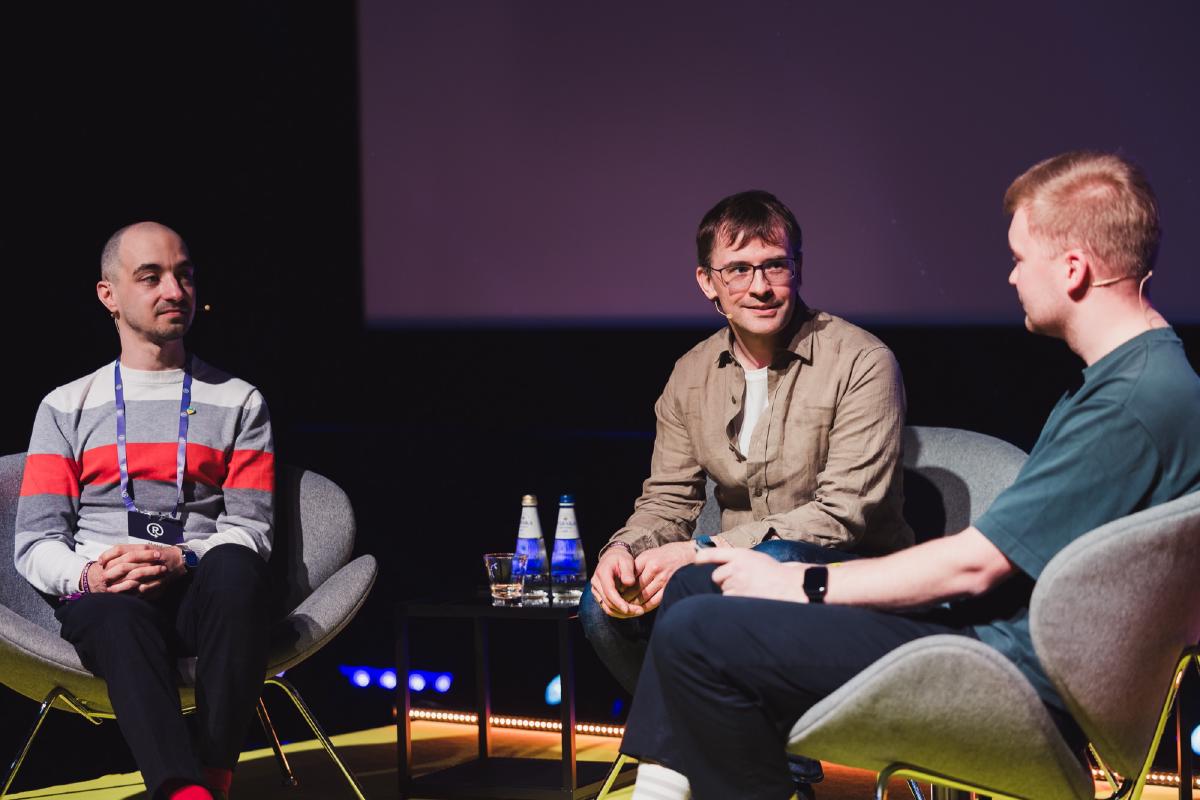
The shift from talking about pixels to talking about customer experience doesn’t happen in a quarter. At Refresh Conference 2024, Slava Shestopalov1 and I discussed in a fireside chat what that shift actually looks like from the inside – what you build, how you communicate it, and how you know it’s working.
One example: two departments had conflicting interests over how to sell their products. I kept explaining what it looked like from the customer’s side – how combining both could support each other’s sales goals. I said this in different rooms, over different months. Around a year later, someone presented the idea as a project proposal. My original arguments were being repeated verbatim.
That is what echoing back sounds like.
UX maturity drives team growth
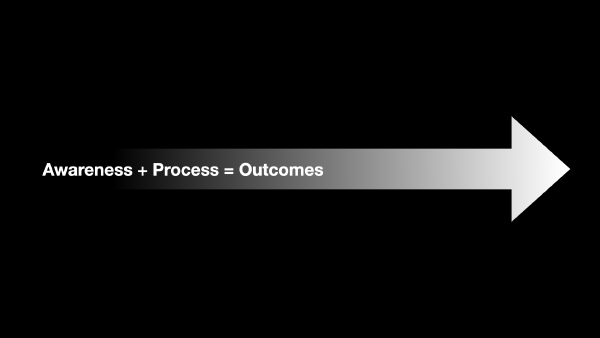
I revisited the benefits of evaluating and applying UX maturity within our organization. Focusing on Awareness, Processes, and Outcomes drives our team’s efforts and growth. Awareness alone is passive and offers limited value without appreciation and support from the broader organization.2
The UX maturity evaluation pointed to one clear gap: designs weren’t consistent, and the cost of inconsistency was growing. We built a design system in three layers – a Figma library for designers, documentation covering rules and guidelines for the broader product organization, and a code library contributed by front-end developers across teams. Starting it was hard. Two years in, we are bearing fruit.
Documenting processes for clarity and efficiency
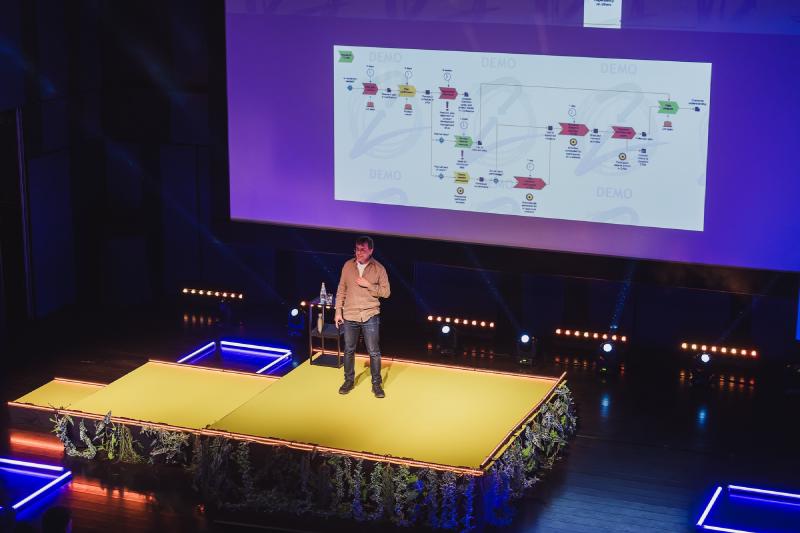
Driven by UX maturity insights, we documented our design team’s process. This allowed us to evaluate each action’s value, dependencies, and impact. The immediate benefits included:
- Understanding the causes of wasteful delays
- Creating easy-to-follow “recipes” for new design projects in project management software
For example, our new process model introduced a “design kickoff” phase, where UX designers collaborate with product managers and developers before starting design work. This simple addition reduced unplanned mid-project changes and improved overall design work completion times by weeks.
Design leadership insights in your inbox
Bi-weekly from my practice. Quarterly exclusives from my practice.
Linking design outcomes to business metrics
Without a mature enough team and organization-wide support, our efforts to set up processes and deliver measurable outcomes were limited. It was a chicken-and-egg situation – we had to drive, lead, and show the way.
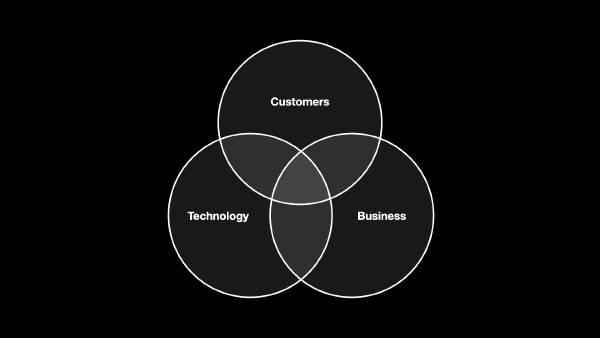
We identified metrics that acted as strategic indicators: connected with organizational goals, financial outcomes, customer satisfaction, and meaningful analytical data. We were cautious about vanity metrics.
For example, we are currently exploring customer journeys sliced into distinct phases. Each phase has a set of metrics to measure customer satisfaction, business outcomes, and technical performance. This lets us tie UX improvements directly to business impact.
Expanding on value and metrics
In a separate conversation with Rene Rumberg3 at Refresh Conference,4 the shift from pixel-level design to experience design became the central question. It wasn’t instantaneous. It took years of persistent communication and demonstration.
“I can measure that in years, as the organization is big, and the only measurement for me was that the message started to go through when I heard it echoing back.”
Our approach to organizational change involved three tracks:
- Education – hands-on Service Design Foundation training where participants interview, test, and experience firsthand how real people challenge their assumptions. We had the information about design. Doing it made colleagues understand what user experience actually means.
- Data-driven advocacy – listing goals and metrics for every project so design decisions were based on evidence, not opinions. We focused on measurable impact on business or reputation.
- Strategic conversations – bringing rich datasets from research across product portfolios, showing leadership how customers perceived us and our offerings. We mapped risks and opportunities to specific points in customer journeys, with clear priorities. That changed the nature of the conversation.
Connecting everything to real money – contracts signed and revenue earned – was the most direct argument.
“Slava Shestopalov,” LinkedIn. ↩︎
This presentation builds on concepts introduced at Refresh 2023 and continues to explore strategic UX leadership. ↩︎
“Rene Rumberg,” LinkedIn. ↩︎
“Shifting From Pixels to Experience: Esko Lehtme’s Strategic Approach to Evaluating UX-Design and Customer Experience at SEB,” Refresh Conference. ↩︎